The basics of life cycle impact assessment (LCIA)
– written by Shivam Mishra, Sustainability Analyst, and Ellie Williams, Sustainability Consultant

Life cycle impact assessment (LCIA) or in short ‘impact assessment’, is the step in life cycle assessment (LCA) where a long list of inputs and outputs is converted into the potential environmental impact. It answers the question: How much of an impact do these emissions and resource consumptions cause on the environment?
Getting your life cycle model ready for the LCIA step
In a life cycle model, you create many links between processes. These processes have direct inputs from and outputs to nature, also known as ‘elementary flows’ (see the visual below). The full list of inputs and outputs, which can be very long, is called the life cycle inventory (LCI).
Your LCI is already very useful. It can tell you how much of a specific substance is extracted from or emitted to the environment. However, LCI results alone make it difficult to draw conclusions about the environmental footprint of your product. That’s why we use the LCIA process, which consists of classification, characterization, normalization and weighting, to arrive at an impact measurement. These steps are laid out in the International Standard Organization (ISO) standards for LCA: 14040/44. ISO states some steps are mandatory, and some are optional if you want to be conformant to the standards. This will become important later.
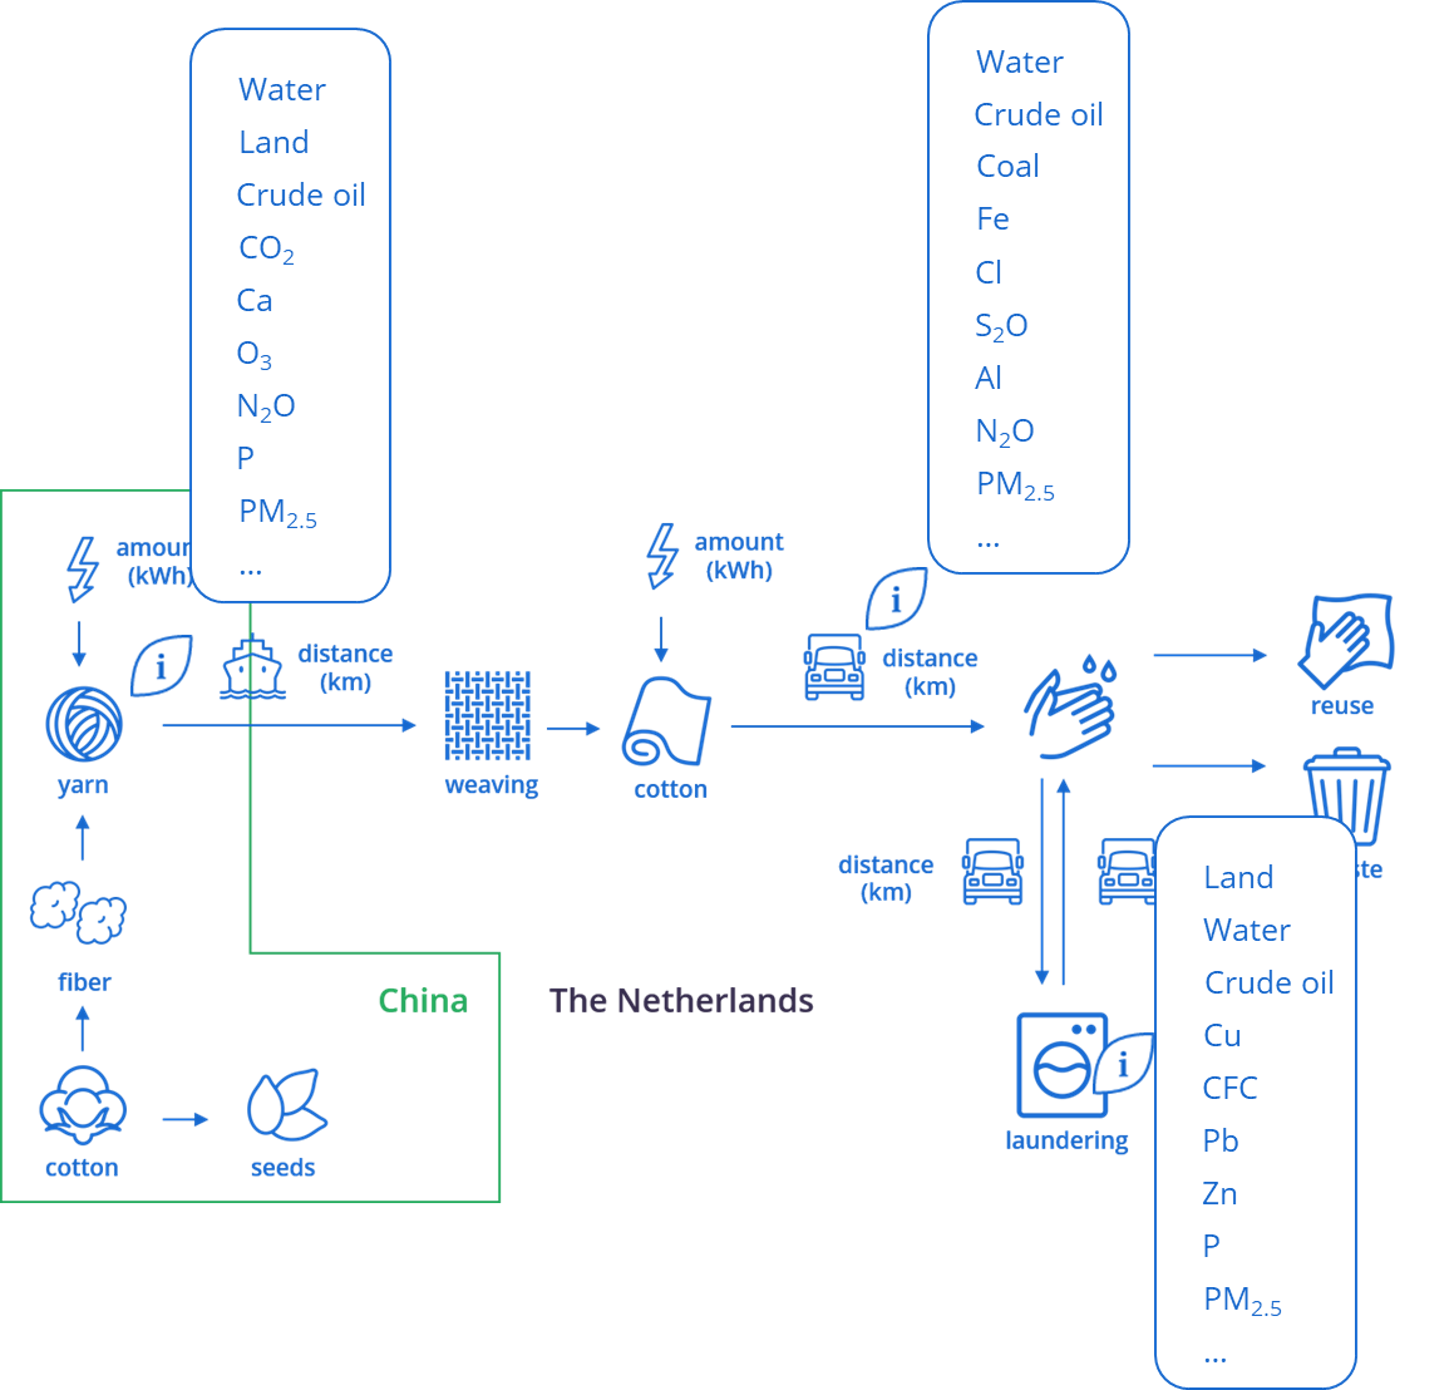 Inventory of some processes in a model of the life cycle of a reusable cotton roll.
Classification
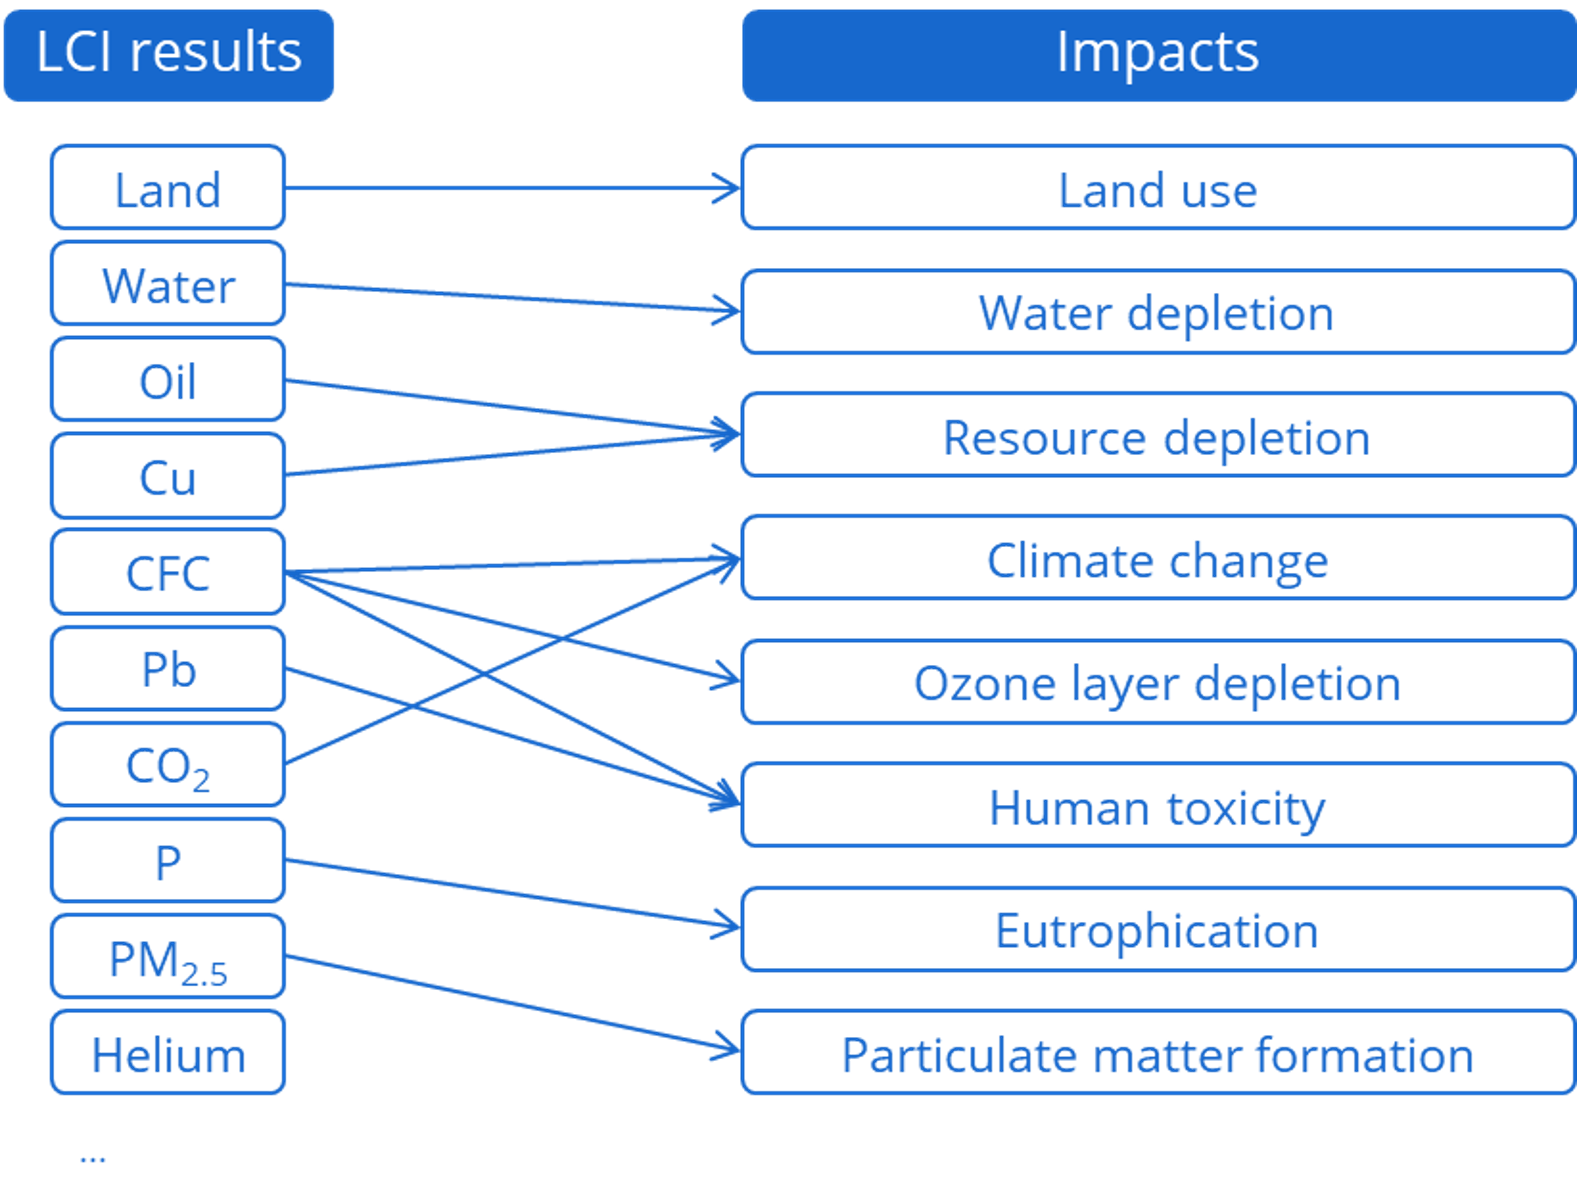
Your LCI is composed of ‘interventions’ which are actions, processes, or activities where people interact with the environment. These result in resource use, or emissions (i.e. elementary flows). In the classification step of LCIA, we identify the effect the different elementary flows have on the environment by sorting them into impact categories.
For example, we assign all flows that result in greenhouse gas emissions to the climate change impact category and emissions of heavy metals to toxicity. Some elementary flows contribute to more than one impact category: as you can see, CFC emissions contribute to climate change, ozone layer depletion and human toxicity. Other environmental flows (here: helium) don’t contribute to any impact categories within the limits of this current impact assessment method.
Characterization
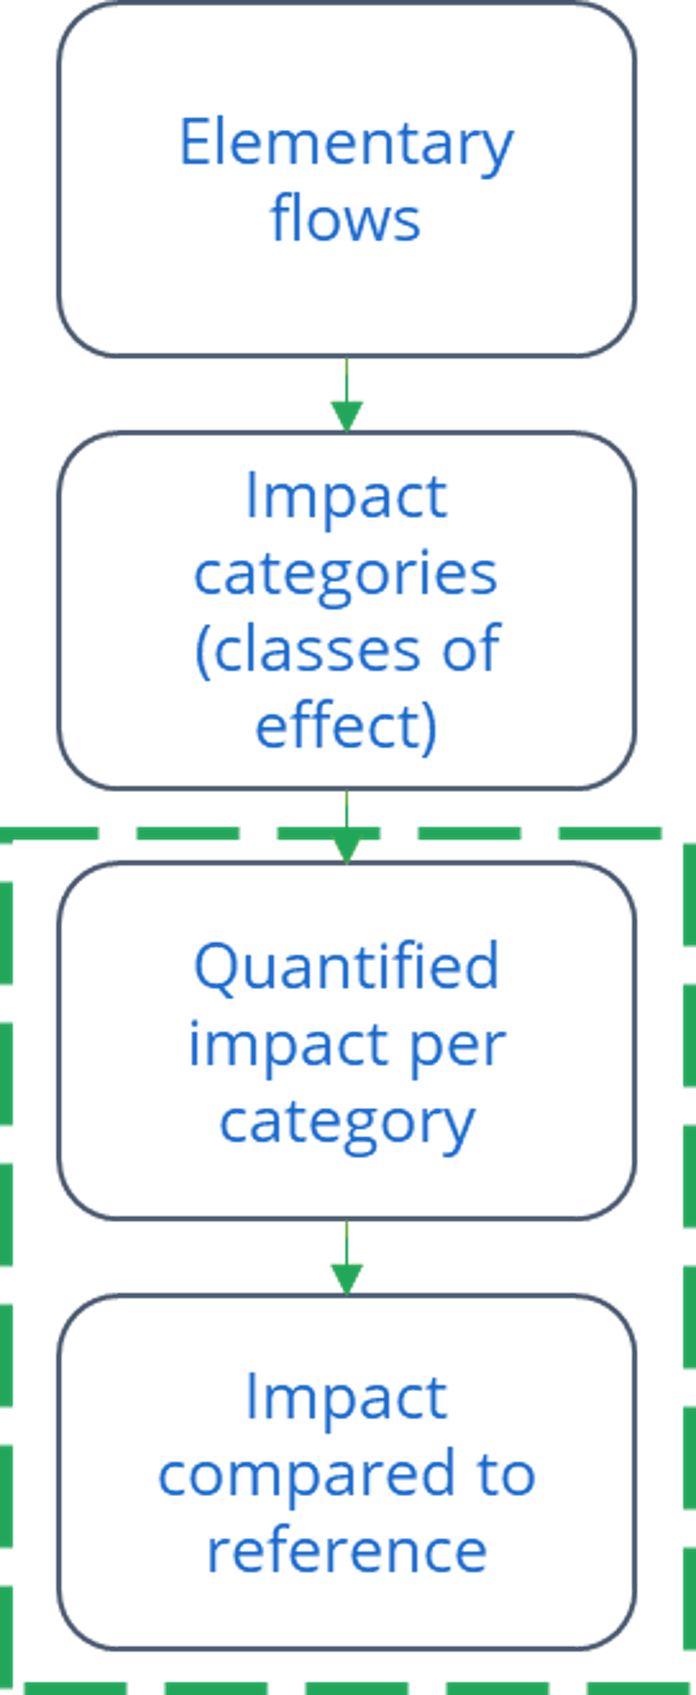
The characterization step quantifies the impacts we classified in step 1. In this step, different elementary flows can have a different impact on the same impact category. Characterization is a crucial part of LCIA; it’s the start of making sense of the raw data.
To understand the impacts of a product or service on an impact category, we need to sum up the impacts from all the different substances classified in that category. To do this, we need to define a common unit. Think of it like converting different currencies (like dollars and rupees) into euros so you can add them up. One dollar is closer to one euro than one rupee is, just like methane has a more potent effect on climate change than carbon dioxide and like using water from Egypt has a bigger impact on water scarcity than using water from the Netherlands.
This impact intensity (i.e. the potency) is expressed with characterization factors (CFs). The characterization factors of different substances reflect their potency relative to a reference unit. Emitting 1kg of methane is equivalent to emitting around 30kg of CO2 – so the value of the CF is 30, and the reference unit is kg of CO2 equivalent (CO2eq). For water scarcity, there are different methods, with their own calculations. In one example, the reference unit m3 deprived isn’t related to a specific substance, but measures how much water is lacking relative to demand. Here, too, you can see the relative scarcity (i.e. the ‘potency’ of extracting water) in the CF. The CF for Dutch water is 1.17, which is far lower than Egyptian water which has a CF of 98.4. Having a common reference unit means we’re able to sum up the impact of these different flows within each impact category.
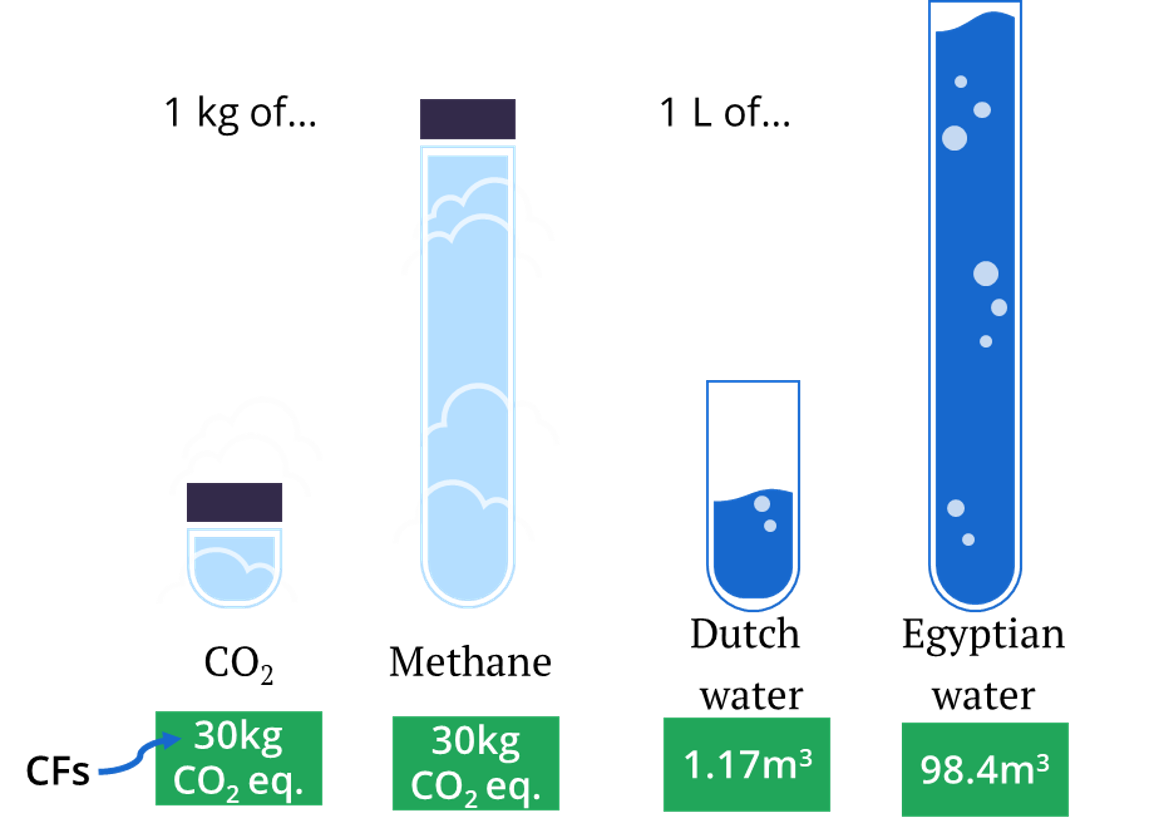 Visual of characterization of different flows (not precisely to scale)
In the characterization step, you multiply the flows from your LCI with their CFs and sum them together per impact category. That sounds like a lot of work, but don’t worry. LCA software like SimaPro will it for you.
Note that, although there are many approaches to LCA and levels of rigor for LCIA, characterization is an integral step. It’s the first step that translates raw data into environmental impacts. This importance is reflected in the ISO standards, which identify characterization as a mandatory requirement for ISO-conformant LCA.
For climate change, there is a universally accepted characterization method. For other impact categories, however, there is a range of characterization models to choose from. As a result, since an impact assessment method is a collection of characterization methods and other choices, there are many different impact assessment methods to choose from. Different methods include different types of environmental impacts (some assess just one impact category, while others assess multiple), and different reference units and characterization factors. In addition, some methods assess impacts at a midpoint level, and others at an endpoint level. Take a look at the table overview of different LCIA methods below!
Normalization
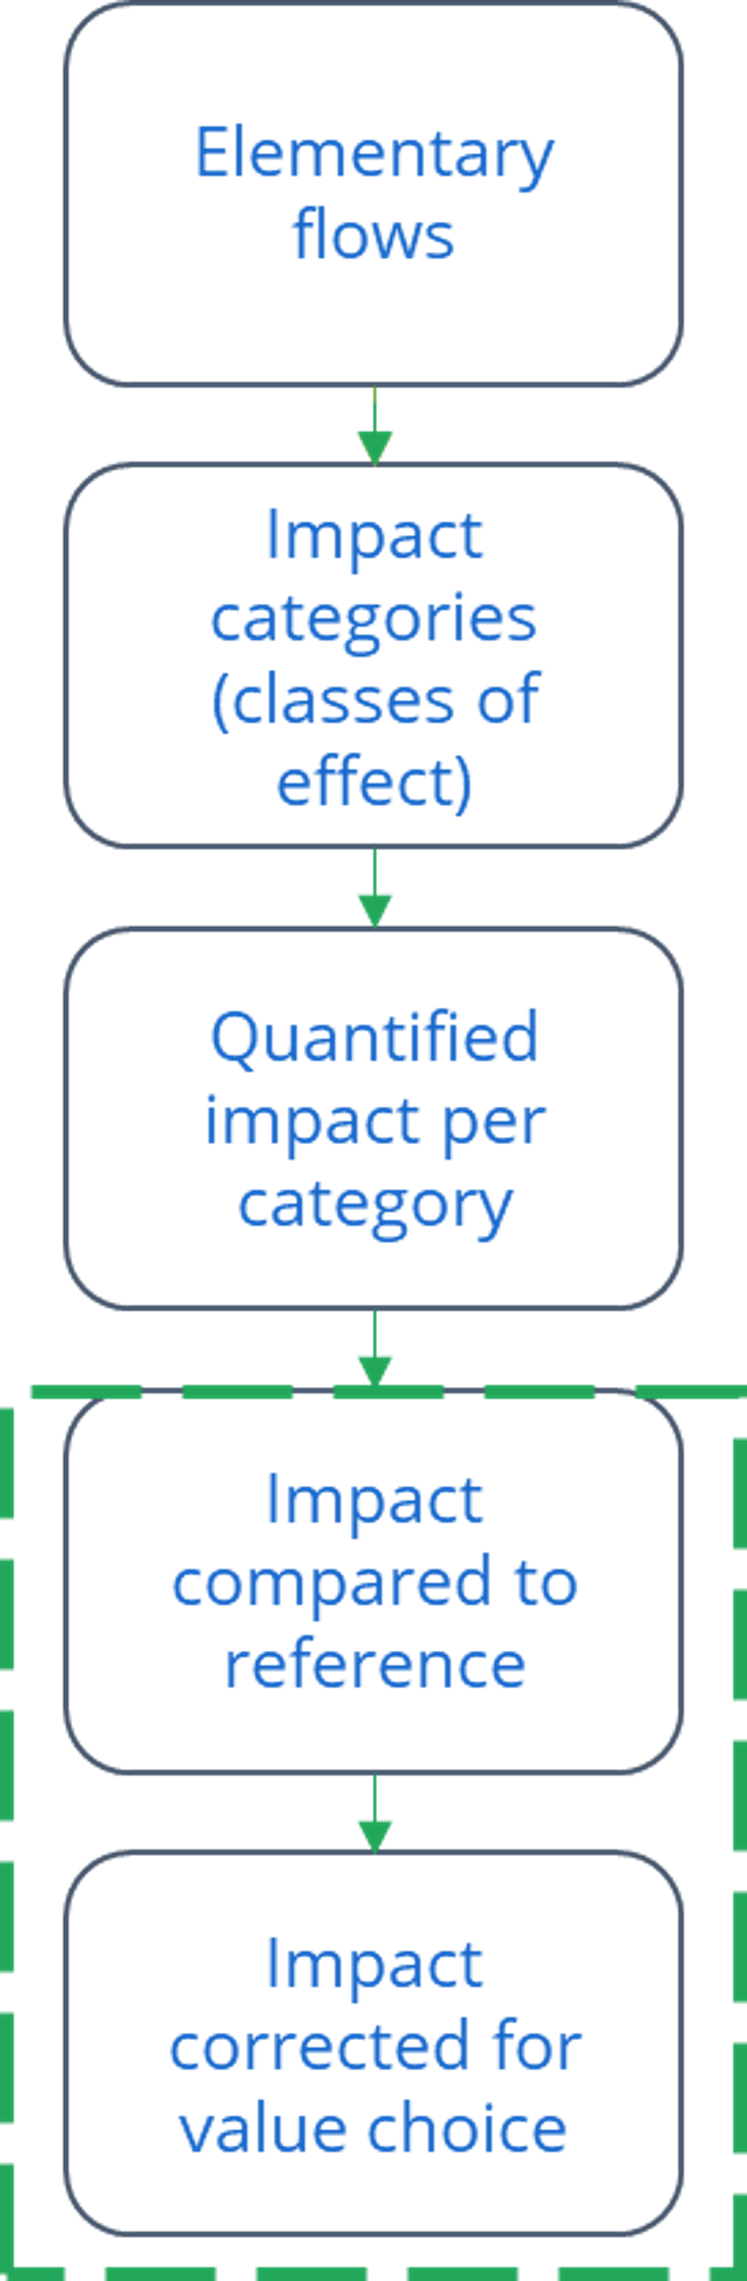
The result of the characterization step is a tidy total number per impact category, expressed in a reference unit. But we’re still dealing with different reference units for each category, which has two drawbacks. One we can’t compare them directly, and two, it’s hard to know whether the results are high or low, relatively speaking. Normalization takes those amounts and compares them to a relevant average or a reference situation.
Let’s say an average person emits approximately 7.55 tons CO2 eq. per year. This is calculated as average emissions per person = annual global emissions / global population. This reference value can then be used as the normalization factor for your previously characterized results (see example below).
1 liter of milk has an impact of about 1.5 kg CO2eq.
For comparison, global greenhouse gas emissions in 2010 were about 7.55 ton CO2 equivalents per person per year. (Source)
Therefore, the impact of one liter of milk is equivalent to approximately 1.5/7550= 0.0002 person-year (or 0.02% of an average person’s total impact per year).
This helps put your characterized results into context, giving you an idea of the impact’s magnitude.
This just one type of normalization, using global annual emissions and a global population. This exercise can be done for any impact category and other scales:
- Per country or region (per-person emissions in Europe are higher than the global average)
- Compared to planetary boundaries
- Using sector-specific baselines (such as the European food basket)
- Using historical baselines (to compare with past performance)
Normalization is not required for ISO-conformant LCAs, and not all LCIA methods include a normalization step (see the overview below). You can decide for yourself whether it’s useful for your study. It can be, for several reasons:
- Understanding the magnitude. Normalization gives you an idea of the relative magnitude of your results per impact category.
- Accommodating different styles of interpretation. Normalized results are expressed in comparison to a reference situation, instead of many different reference units. Depending on your audience, this may be useful for communication.
- Comparing impacts. After normalization, you can compare impacts between impact categories. This helps to see which impact categories are most relevant for your product.
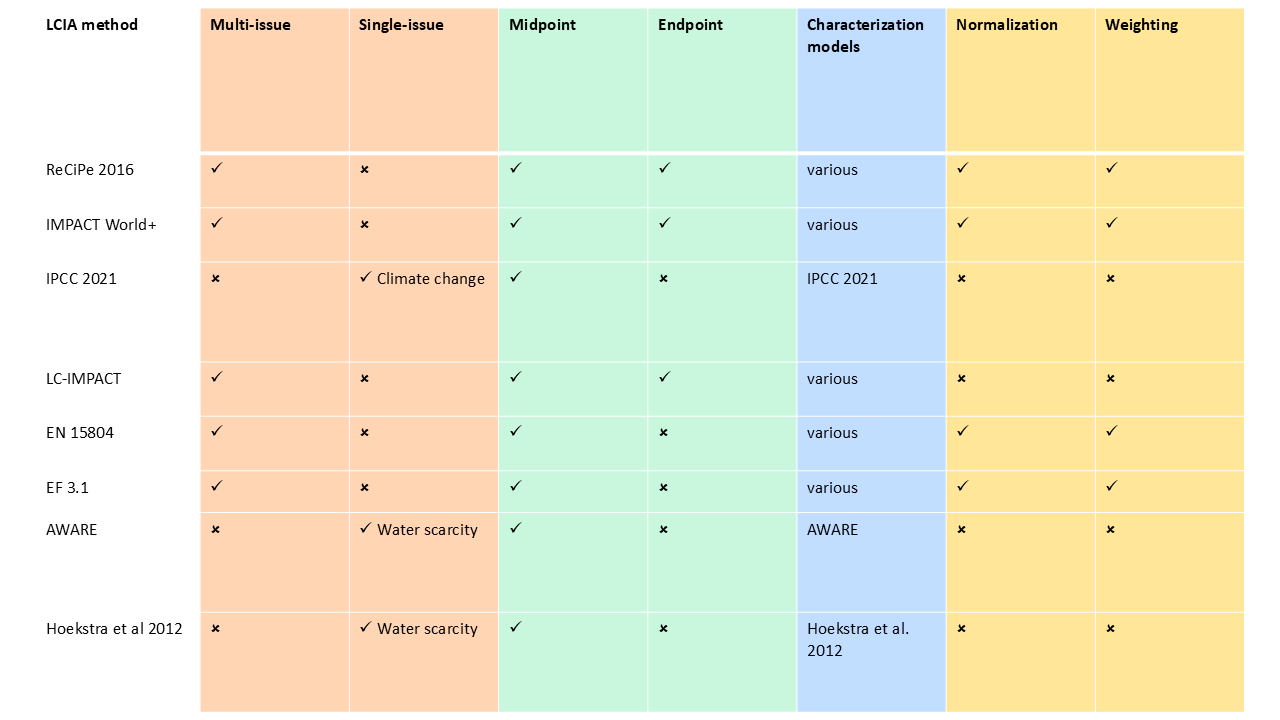 Overview of a subset of LCIA methods with different characteristics to do with classification, characterization, normalization and weighting.
Weighting
If you need an overall impact score, weighting is the next step. It will create a score that includes which impacts are most important to you, and allows you to compare the total overall impacts of different products.
This final step is perhaps the most debated. To weight your results, you multiply the normalized results of each of the impact categories with a weighting factor that expresses the relative importance of the impact category. The weighted results all have the same unit and can be added up to create one single score for the environmental impact of a product or scenario. Simply put, weighting means applying a value judgment to your LCA results. What makes this step controversial is that the weighting factors you choose can influence the results and conclusions of your LCA.
Continuing the money analogy, weighting is like deciding which types of spending matter most to you. Even if you know how much each impact is worth compared to an average annual income (normalization), you might value some impacts more than others. For example, you might decide that €1 spent on healthcare is more important than €1 spent on travel. In LCA, weighting applies a similar principle: you assign a relative importance to impact categories based on value judgments or stakeholder priorities, which can then guide decision-making.
A higher weighting factor (WF) indicates greater perceived relative importance. As an example, take a look at the weighting factors of the EF3.1 impact assessment method, shown below. You can see that climate change is perceived to be most important, and human toxicity non-cancer as the least important.
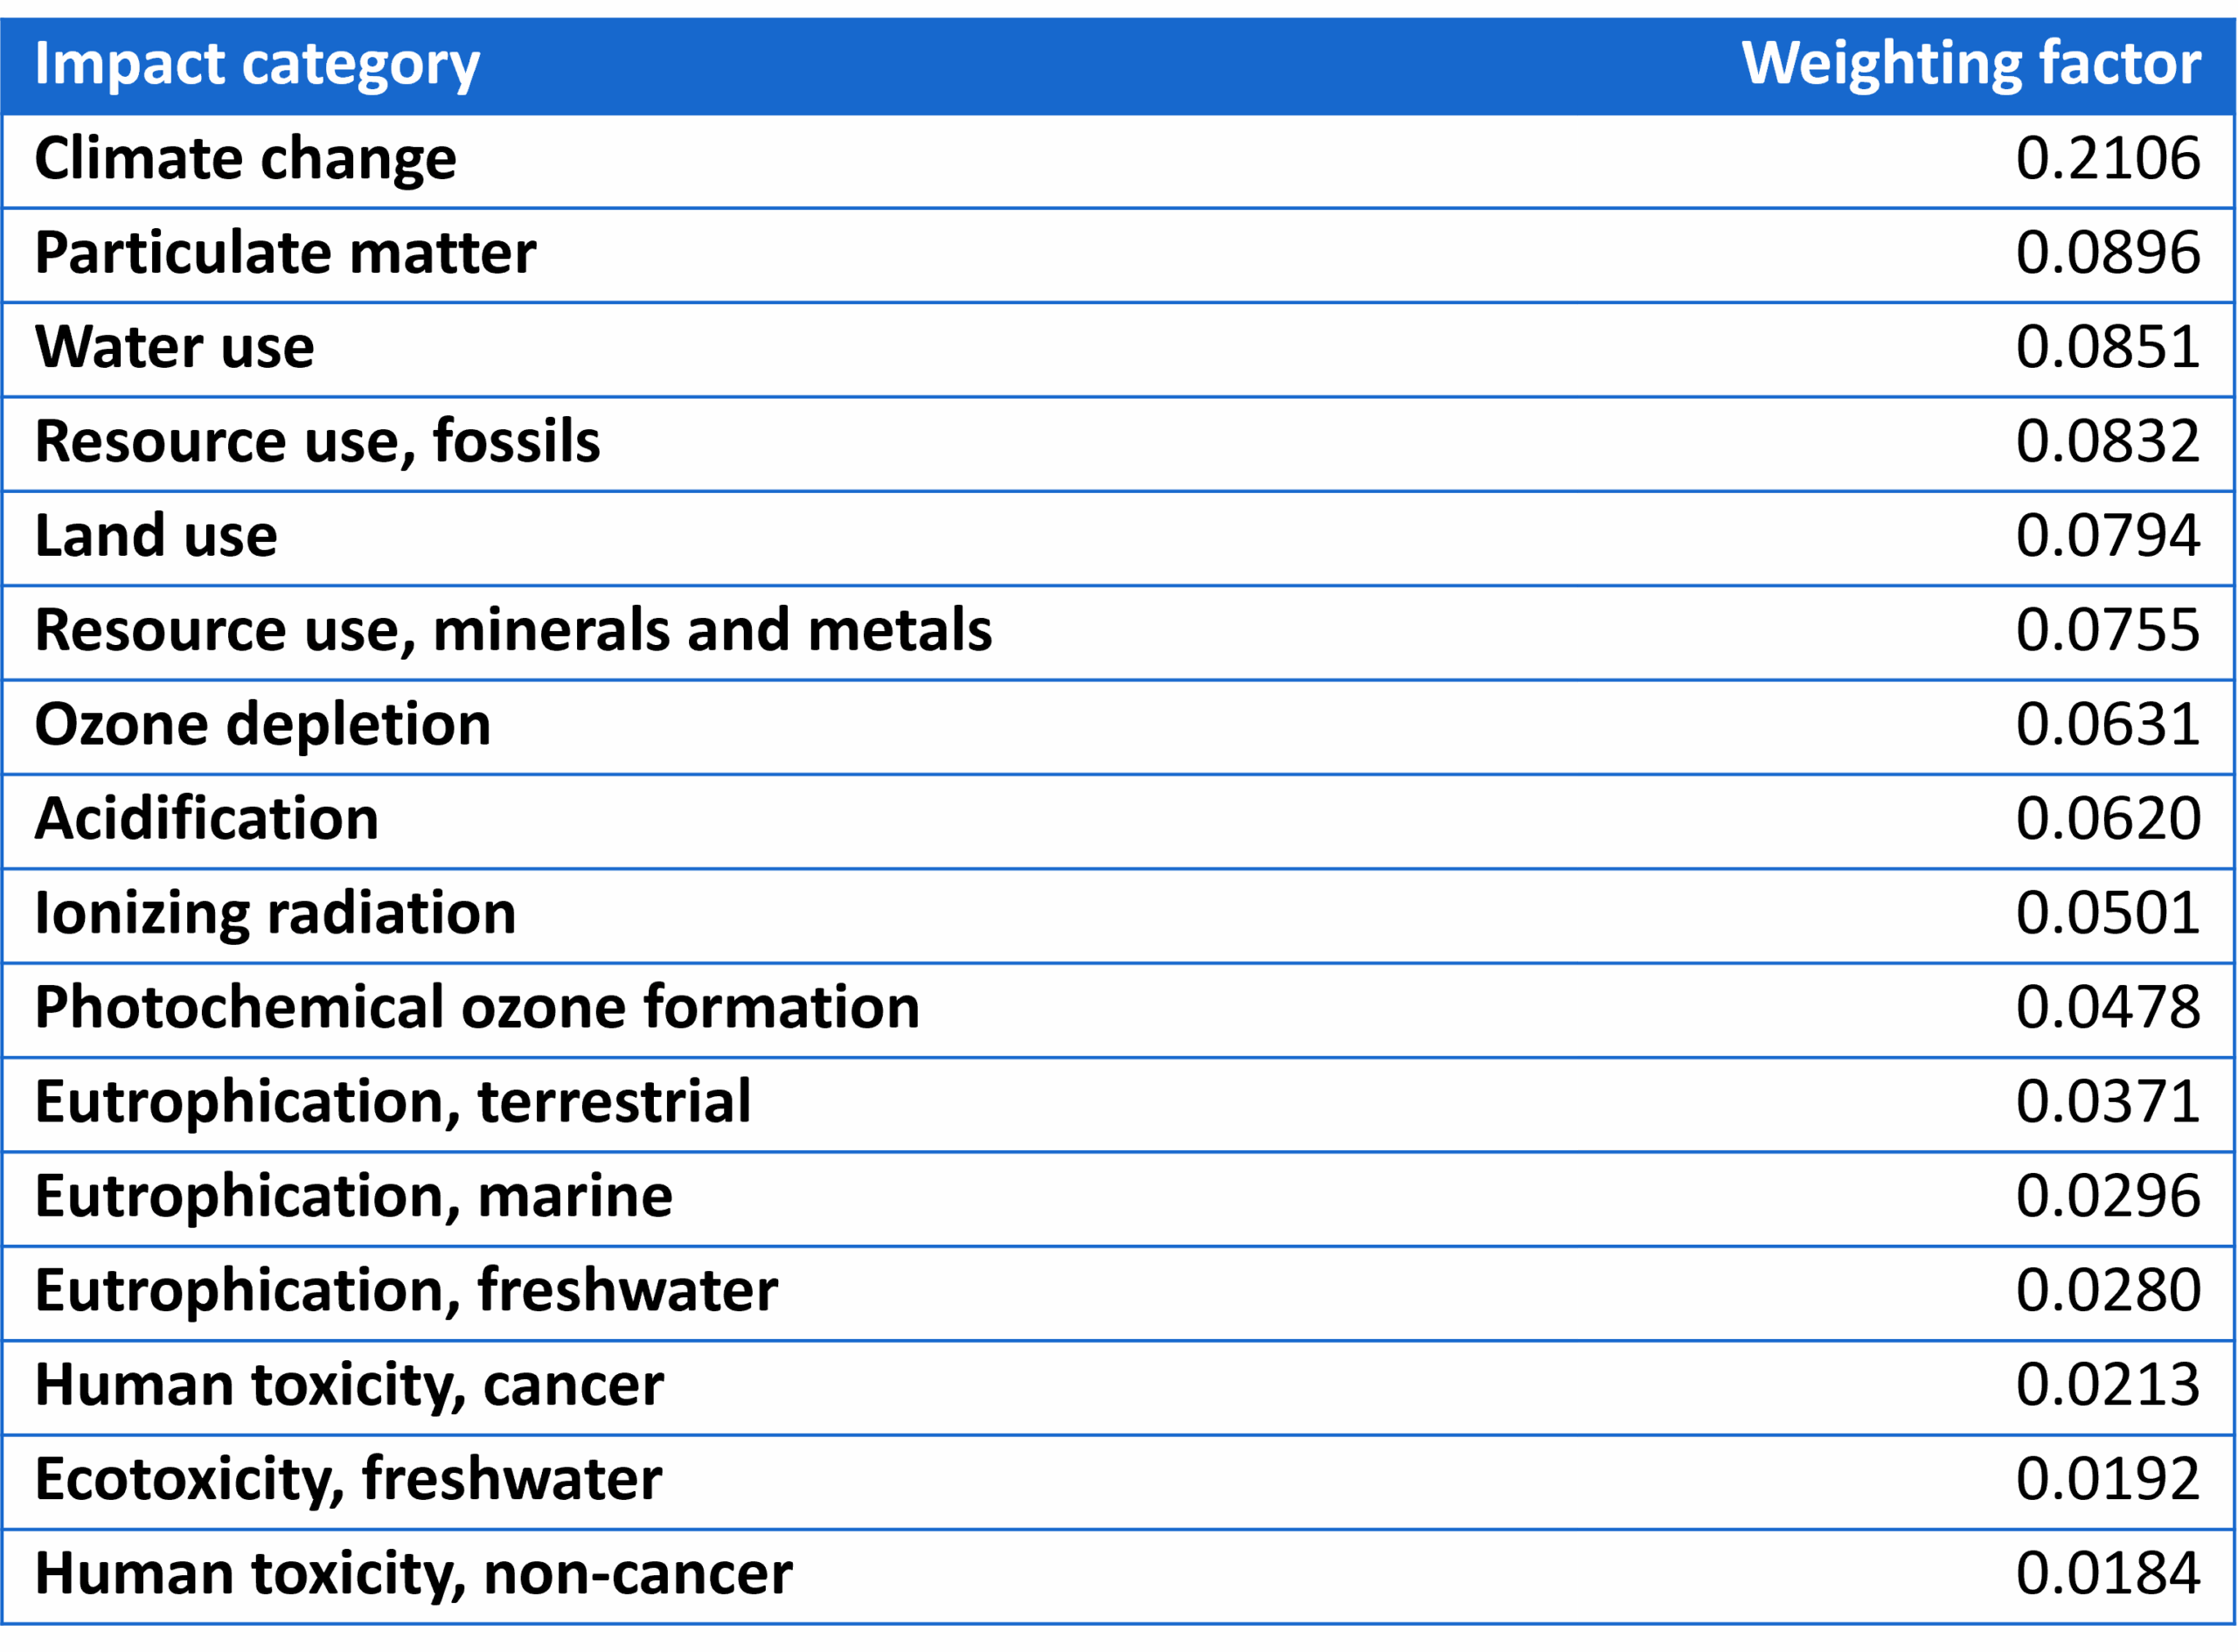 Weighting factors of the EF3.1 method, sorted highest to lowest. All weighting factors add up to 100% (i.e. 1.0).
To calculate weighted results, you multiply the normalized results of each impact category with the weighting factors. The weighted results for each impact category are shown in the unit Pt (or ‘points’). This is a dimensionless factor representing the characterized, normalized and weighted impact. These weighted values can be added up to obtain a single, aggregated environmental impact score: the so-called single score. Especially in cases where there are vast differences in relative importance of the impact categories and in relative size of a product’s impact per category, this single score can help you identify which impacts are most relevant for this product.
The process of determining weighting factors reflects subjective judgments about which impacts you consider more critical. This relative importance can be determined based on several aspects. For example:
- Distance to target: how current environmental impacts compare to reduction goals or targets. These targets might be based on scientific or policy benchmarks. An example of this is weighting factors based on planetary boundaries.
- Monetization: weighting based on economic value, such as the willingness to pay to avoid environmental damage. This approach translates impacts into monetary terms, including considerations like the value of preventing harm to human lives.
- Panel weighting: selecting a group of people to provide opinions or preferences on impact significance. This approach helps incorporate diverse perspectives into the assessment.
The importance of different impacts is subjective and can vary based on individual perspectives and priorities. This subjectivity is why ISO standards do not permit using weighted results in comparative LCAs with external communication. This is to ensure that LCA results remain transparent and objective, focusing on consistent and well-defined criteria rather than subjective opinions.
LCIA is complex – the right LCA software can help
As you’ll have seen from this article, calculating environmental impacts by hand is more than just time-consuming—it’s nearly impossible at scale. Reliable LCA software does the heavy lifting for you.
With leading LCA software SimaPro , you can easily enter your product data, connect it to environmental datasets, and calculate impacts across multiple categories. SimaPro includes a range of LCIA methods, so you can select the approach that works best for your purpose. It’s a practical way to turn complex data into actionable insights, so you can focus on improving your design, strategy, or sustainability goals with confidence.
Want to make your impact assessment smarter and simpler?
Explore SimaPro.
