Biodiversity footprinting explained
– written by Rudri Mankad, Sustainability Consultant, and Colette Grosscurt, Senior Sustainability Consultant

Many organizations already measure their carbon footprint, water footprint, and sometimes other environmental issues like waste. The last few years, biodiversity has also become an important topic on the agenda, which means organizations have started calculating their biodiversity footprint. Biodiversity footprints are designed to understand and report the impact an organization has on the decline or restoration of biodiversity and on the main causes leading to this impact. With this insight, they can evaluate and prioritize mitigating actions or identify opportunities to enhance biodiversity.
What is biodiversity?
Before we can discuss the merits and process of biodiversity footprinting, let’s dig into what the word ‘biodiversity’ means exactly. It’s shorthand for ‘biological diversity’, which is the variability of all life on earth. You can think of the different species in different regions – from the tropical rainforests in the Amazon, to the hot and arid deserts in Africa – but also of all the different flora and fauna you find in just a single area.
Overall, the health and resilience of our ecosystems depend on a high biodiversity. In addition, a great deal of economic and non-economic value is derived from biodiversity. We rely on biodiversity for personal as well as economic reasons, which range from dietary needs (from plant and animal-based sources), and shelter (from wood), to the varied products derived from nature which hold economic value. To survive on our unique planet, we have a high dependency on nature.
Per the definition from the Convention on Biological Diversity, Biodiversity is ‘the variability among living organisms from all sources, including terrestrial, marine and other aquatic ecosystems and the ecological complexes of which they are part; this includes diversity within species, between species and of ecosystems’.
At the same time, humanity causes impacts to biodiversity. Over the last decades, the biodiversity on our planet has come under tremendous pressure. Ecosystems and species habitats have been damaged, and many species face the threat of extinction. To take restorative action, we first need to identify which activities and products contribute to this damage and understand the extent of that damage. This is what a biodiversity footprint helps to capture.
What is a biodiversity footprint?
A biodiversity footprint answers the question ‘What is the impact of an activity or product on biodiversity?’ It’s a science-based calculation model that translates the emissions and resources in a supply chain into a potential impact on biodiversity – on species lost. A biodiversity footprint helps to understand the effects of activities on biodiversity and can be broken down to understand the specific part of the supply chain that causes the potential impact: the ‘hotspots’. The results also provide direction on mitigating and reversing biodiversity loss.
For example, a truck used for transporting goods runs on fossil fuels, which can contribute to climate change. Climate changes in turn impacts biodiversity: for example, as species may not be able to live in certain ecosystems when temperatures rise. In this example, climate change is the cause or ‘driver’ of biodiversity impacts. There are many other such potential drivers, such as land use or water use. Biodiversity footprints help you to understand the relative importance of the drivers, and how much specific activities contribute to the various drivers.
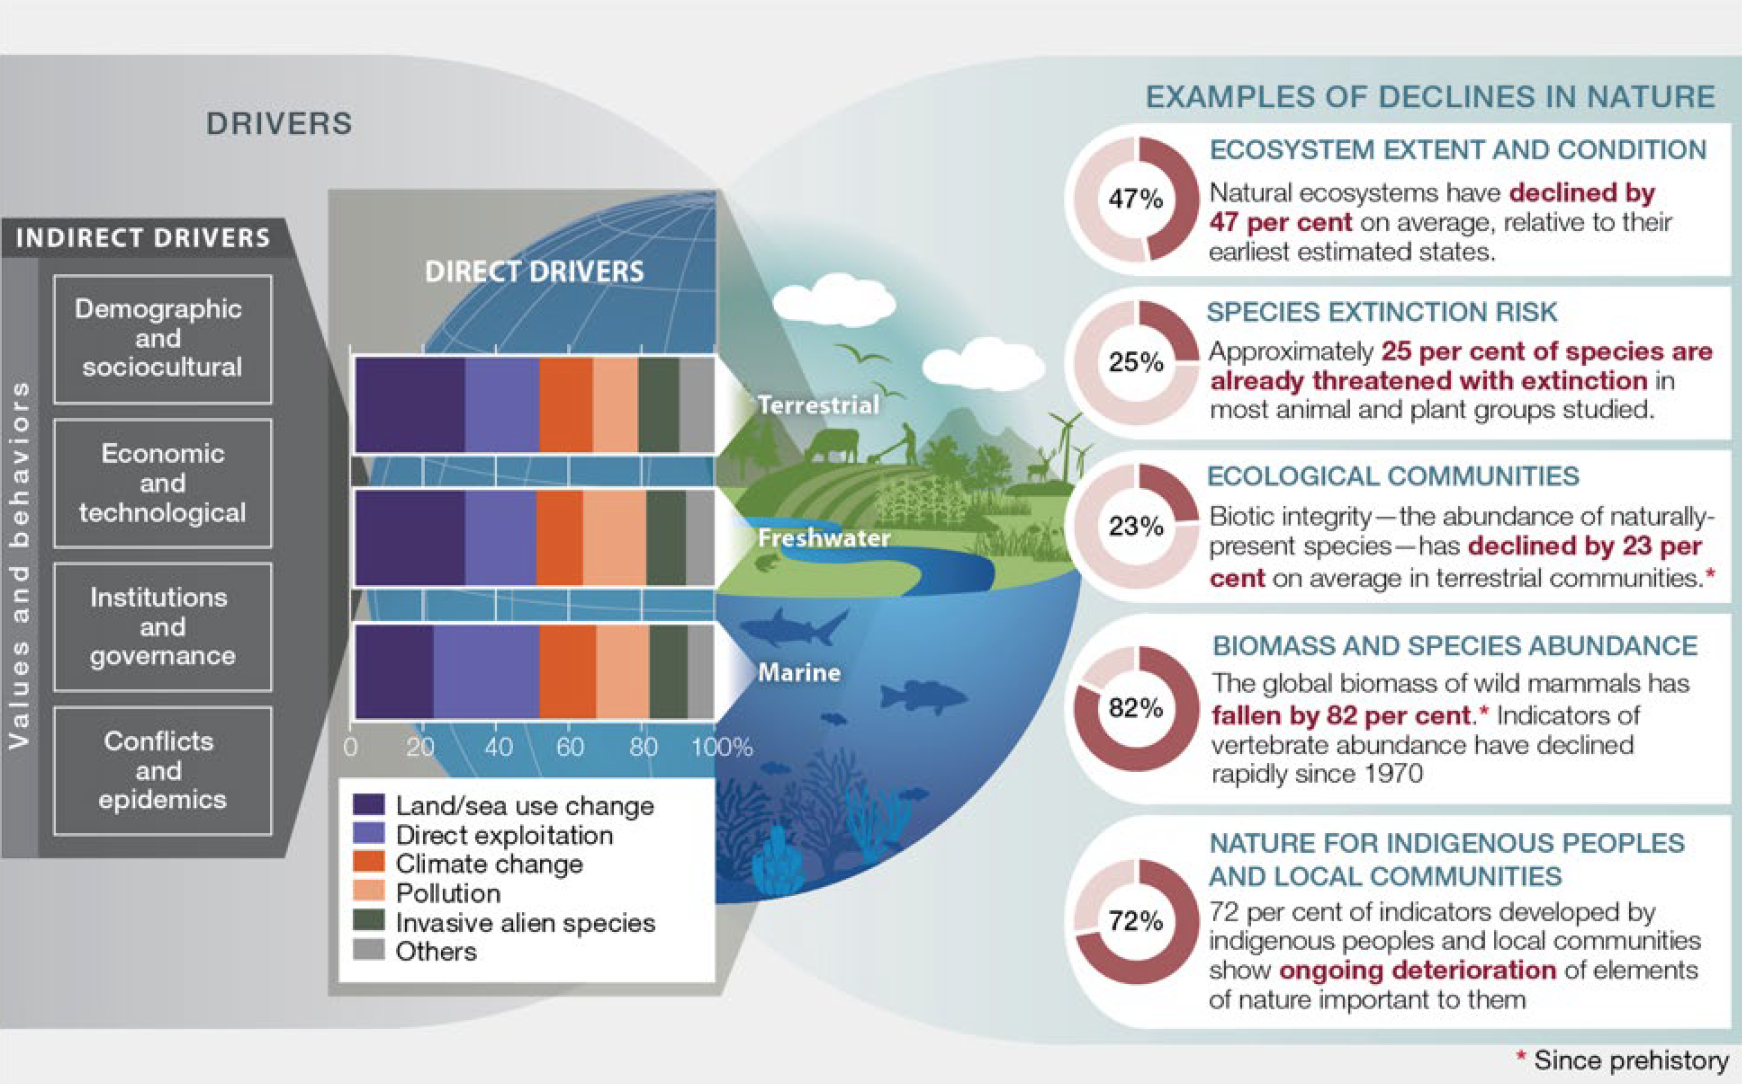
Direct and indirect drivers of biodiversity loss, and examples of decline in nature due to these drivers (source)
Why is biodiversity footprinting important?
Protecting our biodiversity and the fragile ecosystems it thrives in is urgent. This has been recognized time and again through various studies and frameworks, such as the Living Planet Index report and the Planetary Boundaries framework. Most recently, in the Kunming-Montreal Global Biodiversity Framework (GBF). The GBF sets out targets for 2030 to halt and reverse nature loss.
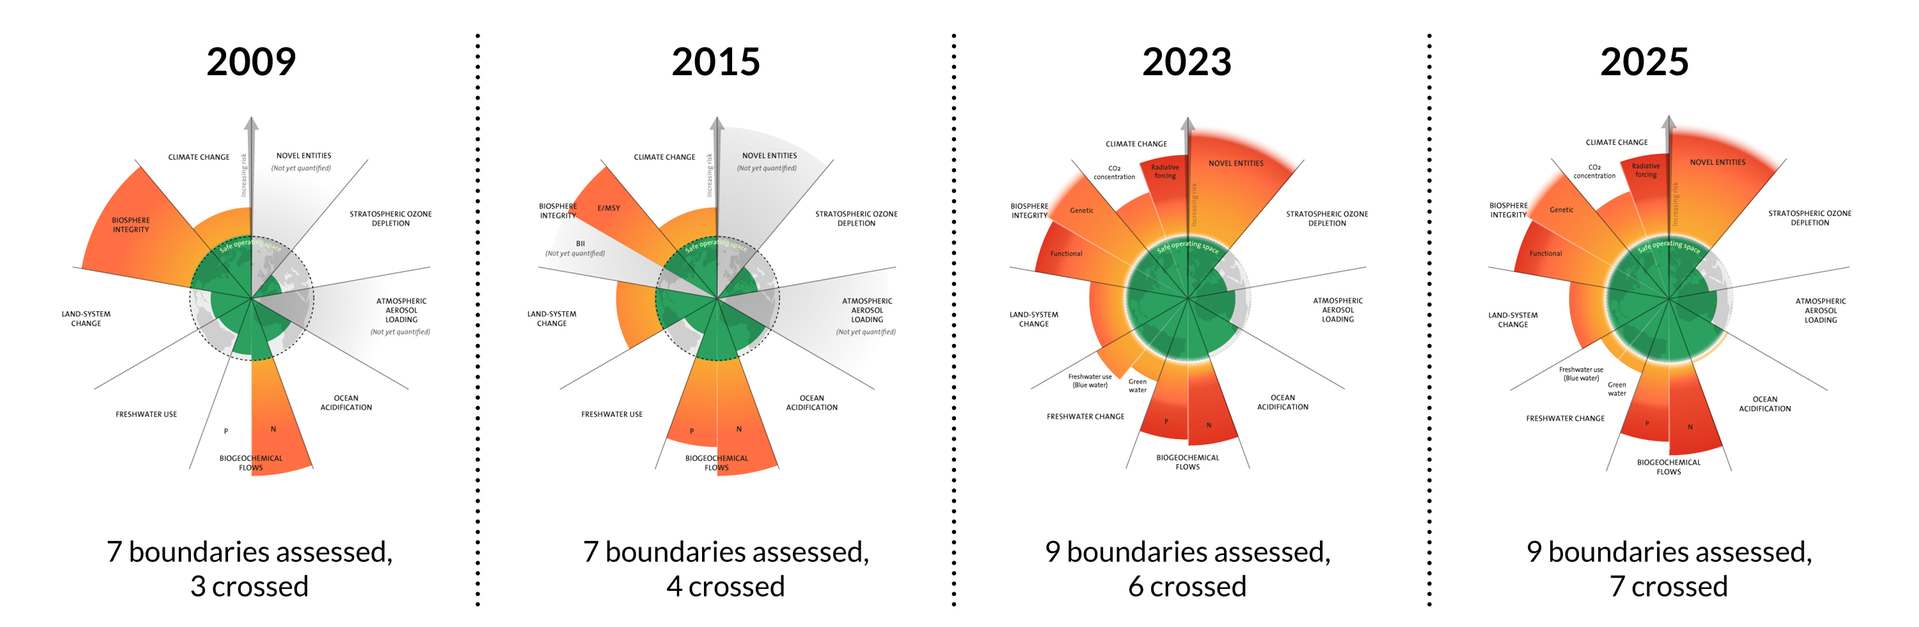 The evolution of the planetary boundaries framework (source)
Although the GBF targets are positioned nationally, the challenge and urgency require a concerted effort by all actors globally. This includes corporations, consumers, and governmental and non-governmental organizations – it’s a shared responsibility.
For organizations with complicated supply chains that span the globe, it can feel like a challenge to even decide where to start, let alone identifying and prioritizing impacts. This is why a biodiversity footprint of a product, portfolio or organization is valuable. The process of carrying out a biodiversity footprint helps organizations map out their supply chains, identify the data needed for calculating the footprint and find gaps where better data would lead to more accurate results over time.
The results of the biodiversity footprint reveal impacts, risks and opportunities to protect ecosystems that businesses rely on. These insights can help businesses trace where they contribute most to biodiversity loss, and identify parts of their supply chains that are most exposed to the risks due to biodiversity loss.
Footprinting results can be used to monitor progress over time and report improvements and recommendations. Finally, biodiversity footprinting can be used as input for policy making to direct action towards biodiversity loss mitigation.
How is a biodiversity footprint different to environmental or social LCA?
Environmental LCA measures a product’s environmental impacts, such as emissions to air, water, and land, across all life cycle stages. It identifies where and how these impacts occur, but it doesn’t directly quantify effects on biodiversity.
Biodiversity footprinting goes further by linking activities to changes in ecosystems and species. While environmental LCAs rely mostly on physical data (like material and energy use), biodiversity footprinting often integrates economic data to map how financial flows drive land use and habitat change.
Both methods overlap in terms of the type of results they give: quantitative values, with results per driver, cause of impact or impact category. The results are supplemented with qualitative insights as needed.
Social LCA, by contrast, focuses on people rather than ecosystems. The focus of a social LCA is on the fair and ethical conditions in the supply chain. Compared to environmental LCAs and biodiversity footprinting, social LCA impacts don’t scale linearly. If you double the emissions that cause pollution, you also double the impact to biodiversity. For a social LCA, the impacts are not considered on a linear scale: half the number of child labor incidents is still a child labor problem.
A similarity between biodiversity footprints and social LCAs is their attention to location: context matters. For instance, the negative effects of mining or deforestation are higher in an ecologically sensitive region than elsewhere for a biodiversity footprint.
How is a biodiversity footprint calculated?
There are several biodiversity footprinting methods available. Your choice depends on the purpose of the assessment and the availability of data, time and budget. For example, a periodical direct measurement of the number of species at a given site is the most accurate, but also resource-intensive and difficult to scale.
The LCA-based approach to biodiversity footprinting is more accessible. As with environmental LCA, this method expresses impacts in various damage categories. For example, ‘damage to ecosystems’, which aggregates damage to freshwater species, marine species and terrestrial species.
The LCA-based biodiversity footprint consists of the following steps:
- Mapping the value chain of the product, portfolio or service by listing all the stages and activities involved.
- Collecting input data about those activities.
- Choosing the impact assessment method, based on the goal and scope of the project.
- Assessing potential impacts using the method and translating them into biodiversity impacts.
- Interpreting the results and supplementing them with qualitative analysis to understand the hotspots and causes behind the impact.
The most commonly used metrics for measuring a biodiversity footprint are the Potentially Disappeared Fraction of species (PDF) and Mean Species Abundance (MSA). For an overview of other metrics used in biodiversity assessments, refer to the metrics and methods section.
The Potentially Disappeared Fraction of Species (PDF) indicates the potential loss of species due to a certain pressure, such as land occupation, eutrophication, or climate change. PDF measures the number of species lost (meaning, the species richness in a certain area) and not the abundance within a species. An example of a biodiversity footprinting method that uses the PDF metric is the Biodiversity Footprint for Financial Institutions (BFFI), which we’ll discuss later.
The Mean Species Abundance (MSA) metric is based on the development of species populations. MSA measures how much the abundance of species in a given area is compared to their abundance in an undisturbed habitat. The abundance of a species is calculated through its number of individuals, density or cover percentage.
Biodiversity footprinting for projects, corporates and investment portfolios Biodiversity footprints can be done on various levels, depending on your scope and intended application: product or project level, company level, or investment portfolio level.
Product or project biodiversity footprints
An LCA-based biodiversity footprint method assesses the biodiversity impact of individual products or projects, from raw material extraction to disposal. The data needed is usually site-specific and granular, which makes the results reliable and detailed. This allows for good levels of certainty in making biodiversity-aware decisions on topics such as sourcing raw materials or product design.
Corporate biodiversity footprints
Calculating the biodiversity impact on a corporate level helps gain insights in risks and opportunities, and in key drivers across operations and value chain. A corporate biodiversity footprint requires input data on resource use, energy use, land use, water use, waste generated and purchases. These data needs are often in line with those required for a carbon footprint, which makes biodiversity footprinting an excellent add-on to existing corporate assessments.
It’s also possible to calculate the potential biodiversity impacts of different product categories. This allows companies to compare their performance across categories and steer improvements in their portfolio. The data needs are company-specific, but often less granular than product or project-level analyses.
Overall, a corporate biodiversity footprint can:
- inform reporting, such as under the Corporate Sustainability Reporting Directive (CSRD)
- guide decision-making at the product portfolio or strategy level, like selecting where to source wood or water
- reveal gaps and improvement opportunities, for instance by using site-specific data for wood sourcing in the biodiversity assessment
Investment portfolio footprints
The BFFI method, which we mention earlier, is well-supported and aligns almost fully with the Partnership for Biodiversity Accounting Financials (PBAF) standard, which provides guidance for financial institutions in assessing and reporting the biodiversity impacts, risks and dependencies of their investments.
With BFFI, you can calculate the biodiversity impact of individual investments, investment portfolios and loan books. With this information, it is possible to, for instance, make investment decisions based on an impact threshold, have better dialogues with investees, or evaluate and manage the risks of biodiversity impacts. The BFFI also helps you monitor and report on your investment portfolio’s biodiversity footprint.
The data needs for this type of assessment vary based on the size of the investment being assessed. The larger the portfolio (100+ companies), the lower the probability of obtaining detailed data for the assessments. For larger portfolios, there is a higher probability that monetary data is available for the assessments. For smaller investment portfolios where individual assessments are feasible, the data needed is specific to the company and supply chain. The level of granularity and accuracy of results can be improved even further by using spatial data in the assessments, based on Geographic Information Systems (GIS).
Biodiversity is gaining ground in the regulatory landscape
Biodiversity has been rising on the agenda for many organizations. This is due to increasing policy requirements and growing awareness of the risks, given our dependency on ecosystem services provided by biodiversity.
Globally, the GBF we discussed earlier has set a 2030 date to halt biodiversity loss. It has global targets, plus targets at national level for the countries that have adopted the framework. In addition, there are reporting and target-setting frameworks that companies can adopt on a voluntary basis, such as the Science Based Targets for Nature (SBTN) framework that helps companies set impact-reduction targets and prioritize hotspots.
In the European Union (EU), all member states now have policies that are related to biodiversity, directly or indirectly. The EU Biodiversity Strategy for 2030 is a long-term plan initiated for the protection of nature and reversal of degradation of ecosystems in the EU. As an overarching roadmap, it contains existing legislation and additional targets. Some of the significant regulations are:
- The Nature Restoration Law, which came into effect in August 2024 and is aimed at restoring the degraded land and habitats in the EU. It is intended to benefit biodiversity in the European region, but also to enhance food security and enable climate mitigation. The regulation includes binding restoration targets, which member states are expected to submit by mid-2026.
- The Habitats Directive is a cornerstone of the EU biodiversity policy. Its objective is to protect 230 habitat types, which house over a thousand species of plants and animals.
- Additional targets exist for other ecosystems, such as urban and marine.
Biodiversity and nature also play a key role in the mandatory reporting requirements under the Corporate Sustainability Reporting Directive (CSRD). As part of this directive, companies must assess the ‘double materiality’ of sustainability topics like biodiversity – evaluating both their impacts on nature and the financial risks and opportunities linked to biodiversity loss. When biodiversity is deemed material to their operations, companies must follow Environmental Standard 4 (E4) of the European Sustainability Reporting Standards (ESRS).
All of these developments indicate that biodiversity is likely to stay on the regulatory and sustainability agenda, and companies and government institutions must stay on track to meet the targets to contribute to a nature positive economy.
Biodiversity footprinting in SimaPro
Biodiversity footprints can be calculated in SimaPro, just like environmental LCAs. The process uses primary and secondary data to model the activities of a product, organization or portfolio. You can use various databases to supplement available data: ecoinvent or another physical database if you mostly have physical data, or EXIOBASE if your company collects monetary data on e.g. supplier spend or amount invested in a region or sector. Both types of data provide valuable insights, though they differ in the level of detail they offer. Biodiversity footprints based on physical data have a higher granularity than biodiversity footprints based on input-output data.
As mentioned above, the impact assessment method to be used for a biodiversity footprint depends on the goal and scope of the assessment. For example, whether the assessment is done for a reporting exercise or for understanding the impact and its drivers. Examples of impact assessment methods are the BFFI (based on ReCiPe 2016 (H)) and IMPACT World+.
Start your biodiversity footprinting journey
Biodiversity footprinting is a novel field that is gaining more and more traction. You don’t have to navigate it alone. Our consulting services can offer you tailored support, from doing the footprinting for you to building capacity to do them yourself. We are also available for research, methodology development and custom analysis. If you want to understand your biodiversity impact and take meaningful next steps, reach out to our experts or explore our biodiversity assessment services at PRé. Let’s move this important work forward together.